
We use cookies to give you the best experience on our website. It’s not inherently evil, it’s just we like to be under the law. Here's how we will manage them.
BEATING RIVALS
Our model reproduces key features of financial assets and their markets, outperforming both classical as well as cutting-edge stochastic and time series models.
We judge how realistic synthetic series are by measuring some of their “stylized facts”, which existing models fail to reproduce.
Myriad is going to be compared against the three following models:
01
GBM
(Geometric Brownian Motion)
GBM applies drift and volatility factors to an underlying Wiener process. The stochastic differential equation for GBM is given by,
Where:
- dSt is the change in the asset price, S, at time t;
- μ is the percentage drift expected per annum;
- dt represents time;
- σ is the daily volatility expected in the asset price;
- Wt is a Wiener process (Brownian Motion).
02
MERTON JUMP DIFUSSION
GBM does not exhibit price jumps as found in real price series, because the underlying process is continuous. To address this limitation, Robert Merton proposed adding a jump process to an underlying GBM which follows a compound Poisson distribution.
Where:
- Nt is the compound Poisson process with rate λ and Yi is log-normally distributed
03
SARIMAX
(Seasonal Autoregressive Integrated Moving Average with eXogenous components)
This model is an extension of ARIMA that explicitly supports univariate time series data with a seasonal component and adds exogenous regressors to the forecast.
The SARIMAX model is the most recent state-space model for time series analysis, but it is still unable to capture the complexity of financial time series.
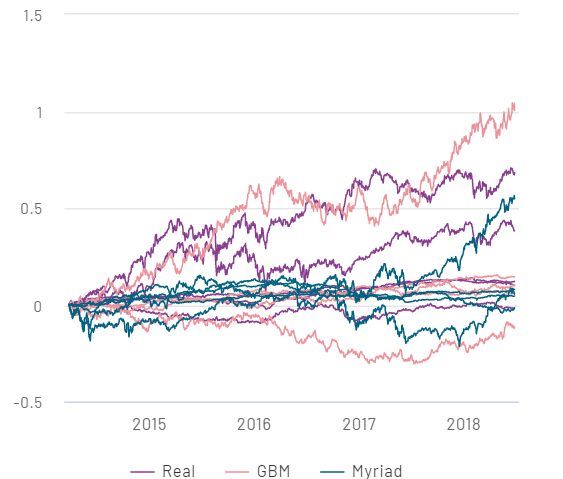
REAL AND SYNTHETIC SERIES COMPARISON
B
FI
FI
Eq
Eq
Real
B
FI
FI
Eq
Eq
GBM
B
FI
FI
Eq
Eq
Myriad
1.0
0.8
0.4
0.0
-0.4
-0.8
-1.0
CORRELATION
Correlation between assets (in this case monthly returns) are crucial characteristics of price series.
GBM doesn't capture the correlation between series.
B = Balanced
FI = Fixed Income
Eq = Equity
DENSITY
The probability densities of returns present high kurtosis, skewness and very heavy tails.
GBM assumes a normal distribution of returns, while this is not the case in real markets.
AUTOCORRELATION
Absolute returns of real series present a degree of autocorrelation between consecutive days, decreasing slowly with time. This is sometimes interpreted as a sign of long-range dependencies present in the markets.
GBM can’t reproduce the autocorrelation present in real markets because of the normality assumption.
VOLATILITY CLUSTERING
Real financial assets undergo different states of volatility, which tend to cluster at certain times.
GBM can’t reproduce the volatility clustering present in real markets.